Ever felt like you’ve carefully analyzed the chart, added RSI, MACD, Bollinger Bands — but price still moves against your position?
That’s not your fault. It’s because retail traders and institutional players are playing on different fields.
What Is Smart Money?
Smart Money refers to large market participants banks, hedge funds, market makers whose movements significantly impact price. They don’t buy or sell all at once. They accumulate gradually, set traps, sweep liquidity, then make their big move.
Smart Money Concept (SMC) is an analytical approach that tries to read traces of their movement directly from price action on the chart.
Meet the SMC Dashboard
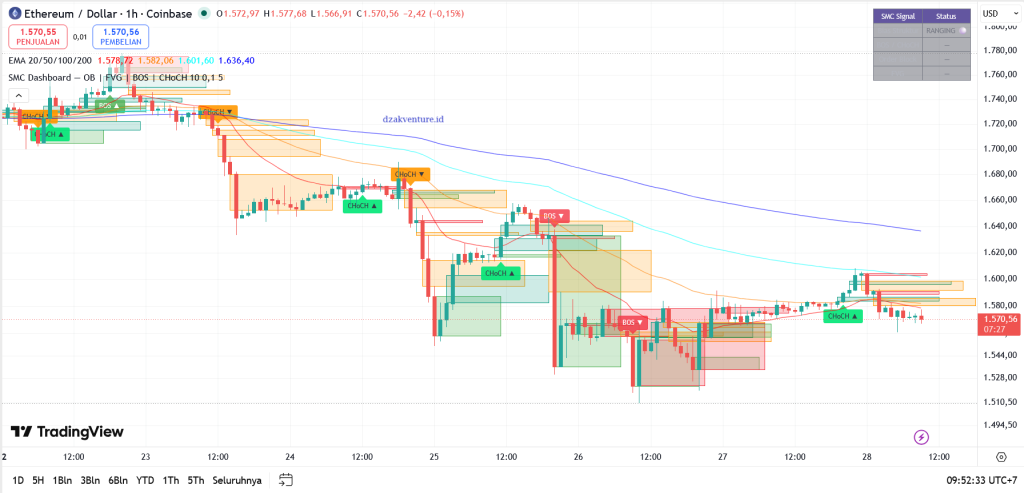
SMC Dashboard is a TradingView indicator by Dzakventure that automatically visualizes four key SMC elements on your chart.
Built with Pine Script v6, this indicator works purely on OHLC price action no lag, no repaint on confirmed candles.
Script link: TradingView SMC Dashboard by Dzakventure
4 Elements Being Monitored
1. Order Block (OB)
Simple terms: The zone where institutional players start placing their large orders.
An Order Block forms from the last opposing candle before price makes an impulsive move. If price rises strongly after a red candle that red candle is a Bullish Order Block. Conversely, if price drops strongly after a green candle that’s a Bearish Order Block.
On the chart: appears as a colored box — green (bullish) or red (bearish).
Beginner tip: Think of an Order Block like a “warehouse” where institutions store their positions. Price often returns to this zone before continuing in the main direction.
2. Fair Value Gap (FVG)
Simple terms: A price gap that hasn’t been filled yet because price moved too fast.
An FVG forms when three consecutive candles leave a gap between the first and third candle with no overlap. This shows an imbalance between buyers and sellers and the market tends to come back to fill this gap.
On the chart: appears as a transparent box in teal (bullish FVG) or orange (bearish FVG).
Beginner tip: FVG is a “price magnet.” Once formed, there’s a high probability price will return to fill it before continuing. Don’t ignore these zones.
3. Break of Structure (BOS)
Simple terms: Confirmation that the current trend is continuing.
BOS occurs when price prints a new Higher High (in an uptrend) or a new Lower Low (in a downtrend). The label BOS ▲ means the uptrend is still strong. BOS ▼ means the downtrend is still strong.
Beginner tip: BOS is not an entry signal. BOS confirms you’re on the right side. After BOS, wait for price to pull back to an OB or FVG before entering.
4. Change of Character (CHoCH)
Simple terms: The first signal that the trend may reverse.
CHoCH occurs when price first breaks through a structure opposing the previous trend. This is not yet a confirmed reversal but it’s enough to shift your analytical bias.
CHoCH ▲ = possible reversal up. CHoCH ▼ = possible reversal down.
Beginner tip: CHoCH is an “early warning.” Don’t enter immediately when it appears. Wait for a BOS in the new direction as confirmation.
Dashboard Panel: Read the Situation at a Glance
In the top-right corner of the chart, a small table shows real-time market conditions:
| Row | Meaning |
|---|---|
| Bias Structure | BULLISH, BEARISH, or RANGING |
| BOS / CHoCH | Most recent structure event |
| Order Block | Whether the current bar formed a new OB |
| FVG | Whether the current bar formed a new FVG |
Always read the dashboard top to bottom. Bias first then look at signals.
How to Read the Chart with SMC Dashboard
Here’s a simple flow you can follow:
1. Check Dashboard → What's the current bias?
         ↓
2. Is there a CHoCH? → Bias may be shifting
         ↓
3. Is there a BOS in the new direction? → Trend confirmed
         ↓
4. Find the nearest OB or FVG in the bias direction
         ↓
5. Wait for price to enter that zone
         ↓
6. Enter after a confirmation candle (rejection/engulfing)
When Not to Use This Indicator?
The SMC Dashboard works best when the market has clear structure. There are conditions to avoid:
- CHoCH appearing repeatedly in short succession → market is choppy, no clear direction.
- Dashboard shows RANGING with no BOS in either direction → wait.
- Too many overlapping OB/FVG boxes → too much noise, zones are unclear.
In these conditions, drop to a lower timeframe to find cleaner structure, or switch to another pair.
How to Install
- Open TradingView → Pine Editor
- Delete all existing code
- Paste the SMC Dashboard code (link below)
- Click “Add to chart”
- Adjust settings for your timeframe
Recommended settings:
| Timeframe | Swing Length | OB Lookback | FVG Min Size |
|---|---|---|---|
| 15m | 3 | 8 | 0.05% |
| 1H | 5 | 10 | 0.1% |
| 4H | 8 | 15 | 0.2% |
Closing
The SMC Dashboard is not a holy grail. No indicator can predict price with 100% accuracy. What this indicator can do is help you read market context where institutions are likely active, where reversals may occur, and how strong the current trend is.
Use it as a map, not a GPS that says “turn right now.”
Access the Indicator:
→ TradingView: [SMC Dashboard by Dzakventure]
→ Full guide (PDF): [SMC Dashboard Complete Guide]
→ Instagram: @de.kripto
Ready to Trade? Start on Gate.io
Once you have the SMC Dashboard on your chart, you need a platform to execute. I personally run my ETH and BTC perpetual futures positions on Gate.io deep liquidity, low fees, and over 1,700 trading pairs including all major crypto perpetuals.
If you’re looking for a solid exchange to put your SMC setups into practice, you can register through the link below. It’s free to sign up and new users may be eligible for a fee discount upon registration.
[Sign up on Gate.io →] (affiliate link)
Disclosure: The link above is an affiliate link. Registering through it supports this site at no additional cost to you.
This article is written by Dzakventure. This content is educational and does not constitute investment advice. Trading involves risk. Always use proper risk management.